


Assessing the Resilience of SMEs Through the Current Economic Recession
by Dr. Gabriele Sabato, Co-founder and CEO Wiserfunding September 4, 2020The COVID-19 pandemic has proved to be the perfect trigger to the current economic recession, but the global economy was already weak and debt levels were at all times high.
When we published our annual report on the “Defaults and returns in the high-yield bond and distressed debt markets” in late February, 2020 (Altman & Kuehne, 2020), the credit cycle was still in a benign state, albeit with some unmistakable storm clouds on the horizon. The four indicators of credit cycle dynamics that we assess were pointing to a fairly average credit environment condition, although a few were approaching the historic average after being considerably below average for some time.
Indeed, we were then approximately 11 years into the so-called benign cycle, which began in the second quarter of 2009. The corporate bond default rate in the high yield (HY) bond market was 2.87% in 2019 (dollar denominated) compared to the historic average of 3.3%; the recovery rate on those defaulting bond issues was 43.5%, compared to a 46.0% historic average; yield spreads required by investors in HY bonds and leveraged loans were about 100 bps below the historic average, and the liquidity in the risky debt segment was extremely high.
Indeed, in the first two months of 2020, new issues were at record levels. The U.S. economy was perking along at a reasonably high rate, certainly at a level above most of the developed world. The outlook for 2020 was still fairly rosy, despite the coronavirus ravaging the Wuhan area in China.
As noted, however, there were some disturbing fundamental financial and economic signals pointing to a potential dramatic change in the credit cycle, especially if the real economy experienced its long overdue recessionary state. We had been concerned with the storm clouds for over two years, but the markets seem to shrug off these problematic fundamentals. Indeed, the stock market had just had an extremely profitable year in 2019, rising about 30%, and HY bond investors enjoyed a return of about 14%.
New issues in 2019 totalled $250 billion in the high-yield bond market and almost $500 billion in leveraged loans. Collateralized loan obligations (CLOs) reached about $650 billion outstanding and “shadow banks“ provided an additional $600-$700 billion, in total. All of these statistics invited a “risk-on”, low interest-rate environment.
Storm Clouds Before the Pandemic
While it’s always easy in hindsight to say that ominous signals of a credit meltdown were clear, we did observe several of these indications in our early 2019 reports. For example, the amount of corporate bonds, both investment and non-investment grades, in the U.S. had doubled to more than $9 trillion at the end of 2019, from what it was in 2009.
The largest growth in dollar amount was in the BBB rating class, to over $3 trillion. Coupled with a similar growth in leveraged loans to over $1.2 trillion, most without any meaningful protective covenants for investors, and historically low interest rates, we can easily see why even the lowest quality, CCC rated issues, had fostered a risk-on, low default rate scenario. In addition, non-bank lending to commercial borrowers, mostly LBO companies, exploded to an estimated 42% of all commercial lending and perhaps $600 billion (Bank of America estimate in 2018). In short a “Debt Bubble” was building almost without pause as of the end of 2019 and into the first two months of 2020.
Sceptics of the Debt-Bubble theory could assert that if the levels of corporate debt were considered relative to equity measured in terms of market values, instead of book values, the corporate debt level was actually lower than it was 10 years ago. While that is true, if you simulated the debt/equity ratio with a 20-40% decline in market equity values, the levels in 2019 would be the highest in modern cycles, except at the time of the highest default year ever, 2009 (See Figure 1).
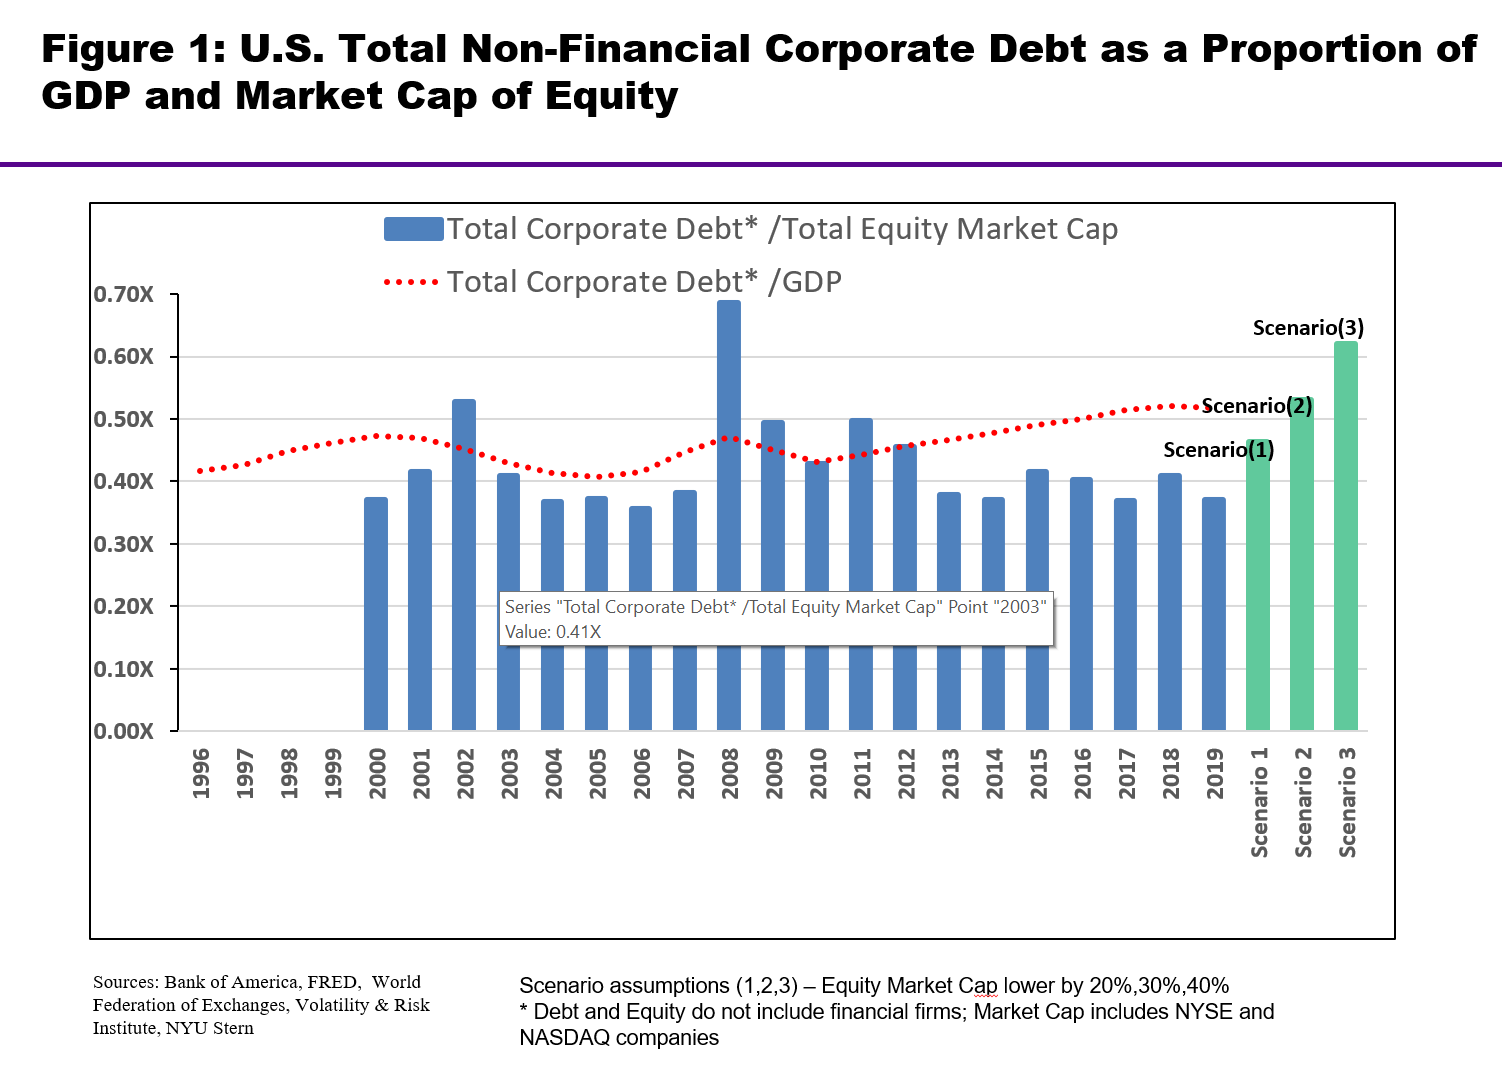
Figure 1
A related storm cloud involved the U.S. levels of non-financial corporate debt (NFCD) as a percentage of U.S. GDP. Figure 2 shows this percentage from 1987-present, with three remarkable peaks in that ratio over this sample period [1990-91 (43%), 2001-02 (45%), and 2008-2009 ((45.2%)]. Also shown in figure 2, are the levels of high yield bond default rates over the same sample.
Note that in every case, peaks in and NFCD/GDP were followed within about 12 months or less, by peaks in the default rate. In 2019 we can observe a new peak and the highest ever at 47%. And as indicated earlier, the default rate at the end of 2019 was still below average. Would that low-risk, default rate continue into 2020 and beyond? To understand the likelihood of defaults remaining at a benign level, we also need to observe that the prior three peaks in debt levels and the subsequent spike in default rates to crisis levels, ie.,2 standard deviations or more above the mean annual rate, occurred concurrently with real economy recessions (see Figure 3).
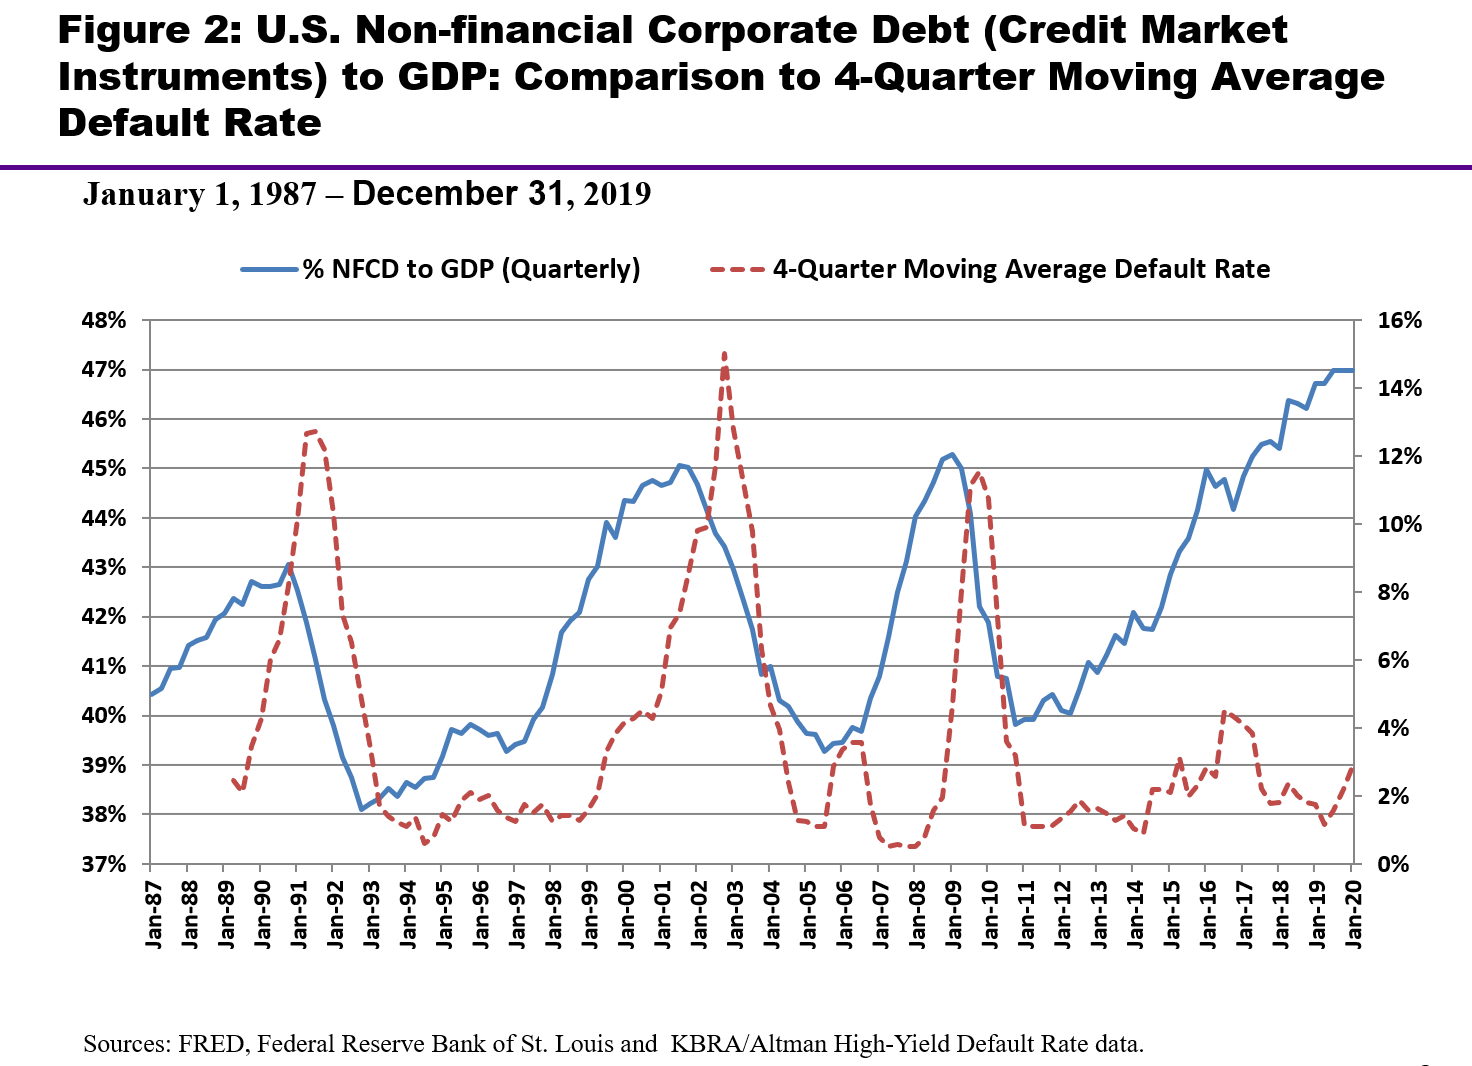
Figure 2
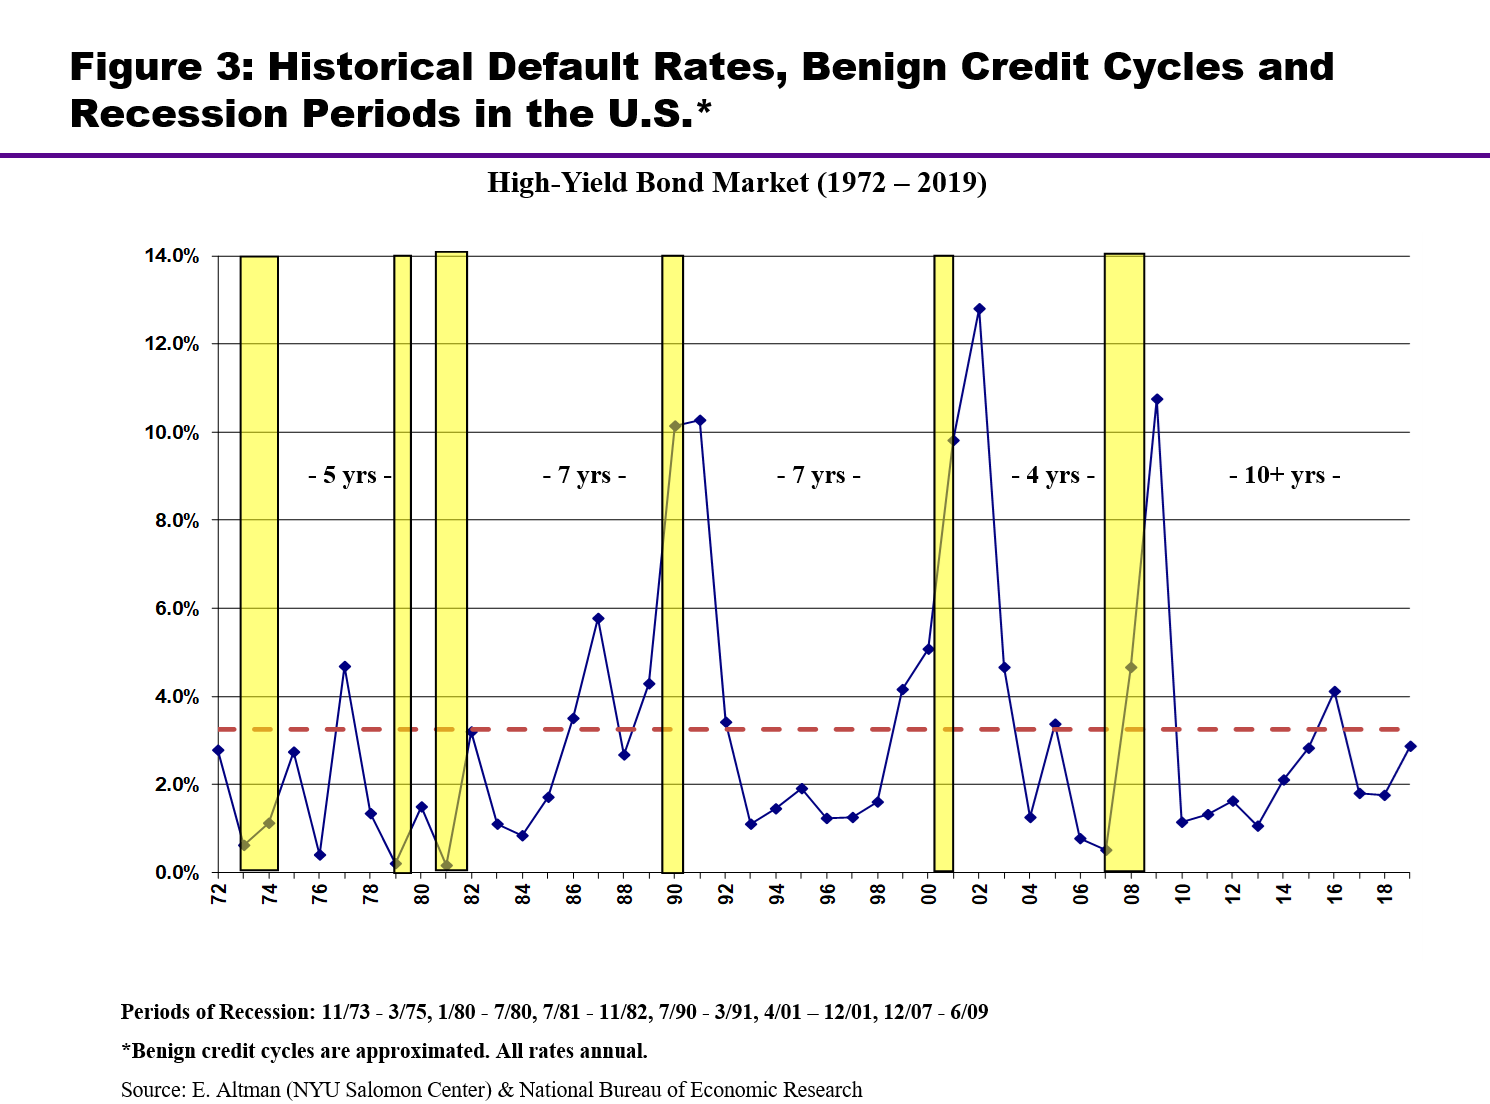
Figure 3
The key question was, therefore, what was the likelihood of an economic recession in 2020 or 2021. We now know some of the answers. Indeed, both Morgan Stanley (30% drop in GDP) and Goldman Sachs (24% drop) are predicting an unprecedented collapse in the real economy. And, this is not just in the US. China, which was already signalling much reduced growth in 2020 even before the coronacrisis, is sure to have at least a short term recession, although there are now signs of a return to some expansion as the health crisis lessens there.
Assessing the resilience of SMEs
Wiserfunding’s SME-focused credit risk-as-a-service platform is a valuable solution for supporting decision-making around SME lending or investing, offering the right mix of speed and predictive power, with accuracy ratios of between 80%-93%. Our suite of credit scoring models, segmented by country and industry, fuse over 50 years of research in default modelling with innovative technology and data ecosystem to generate risk metrics that are essential for SME risk management.
Our cloud-based platform combines advanced statistical techniques, with big-data analytics and AI to model a large set of structured and unstructured data sourced from several external databases via APIs, covering financial, corporate governance and macroeconomic factors. Our models go beyond the maximization of prediction accuracy to replicate human behaviour in the conduct of a holistic credit assessment.
Our models have been developed on a development sample including more than 30 million SMEs across Europe that filed their accounts from 1998 to 2018, thus covering more than 2 economic cycles. We have developed a total of 64 models: 12 country/region-specific models for Europe and 4 generic models for countries outside of Europe (i.e. North America, Australia, Asia and Middle East, see figure 4).
Each model is segmented by industry sector with a minimum of 4 and a maximum of 8 sectors (i.e. Agriculture and mining, manufacturing, energy/recycle and waste, construction, retail, leisure, real estate and business services). For countries/regions where smaller firms can submit simplified accounts, we have also developed a specific model for these firms.
We believe that segmentation is a key factor to improve the performance for SME credit risk models. Small firms are totally different by size, industry sector, country in which they operate and these factors need to be considered when developing homogeneous samples.
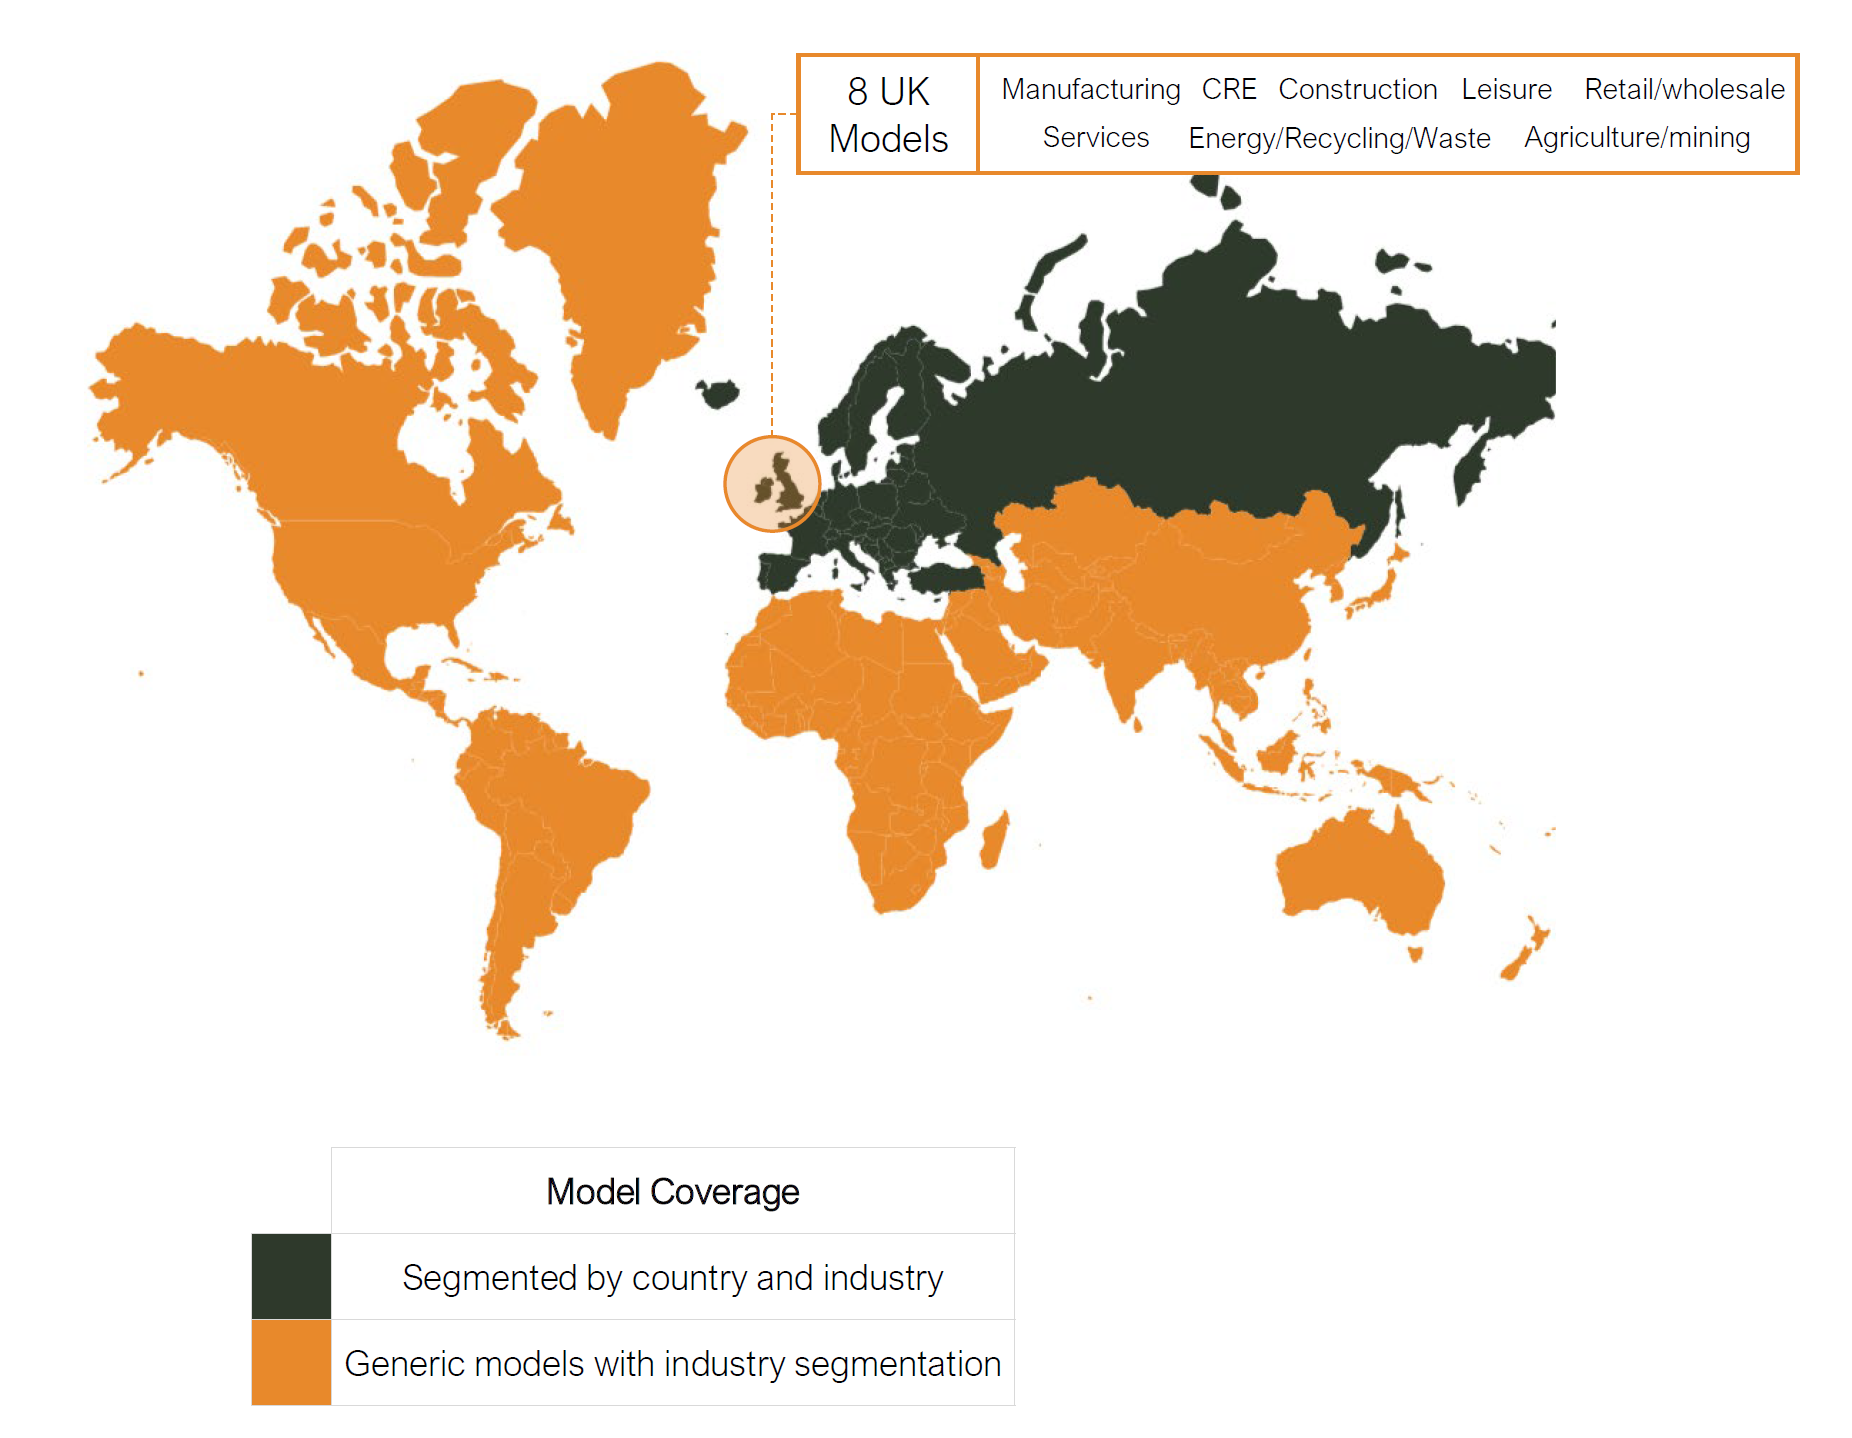
Figure 4
We use a large amount of structured and unstructured data to assess the creditworthiness of SMEs. Our models do not only maximize the prediction accuracy but aim at replicating the human behaviour by assessing everything that a credit analyst would review when trying to evaluate the risk profile of an SME. This helps to create trust and credibility in the risk assessment; therefore, all our models are structured in the same way with 3 modules looking at the full spectrum of information that matters for SMEs: financials, corporate governance and macroeconomic.
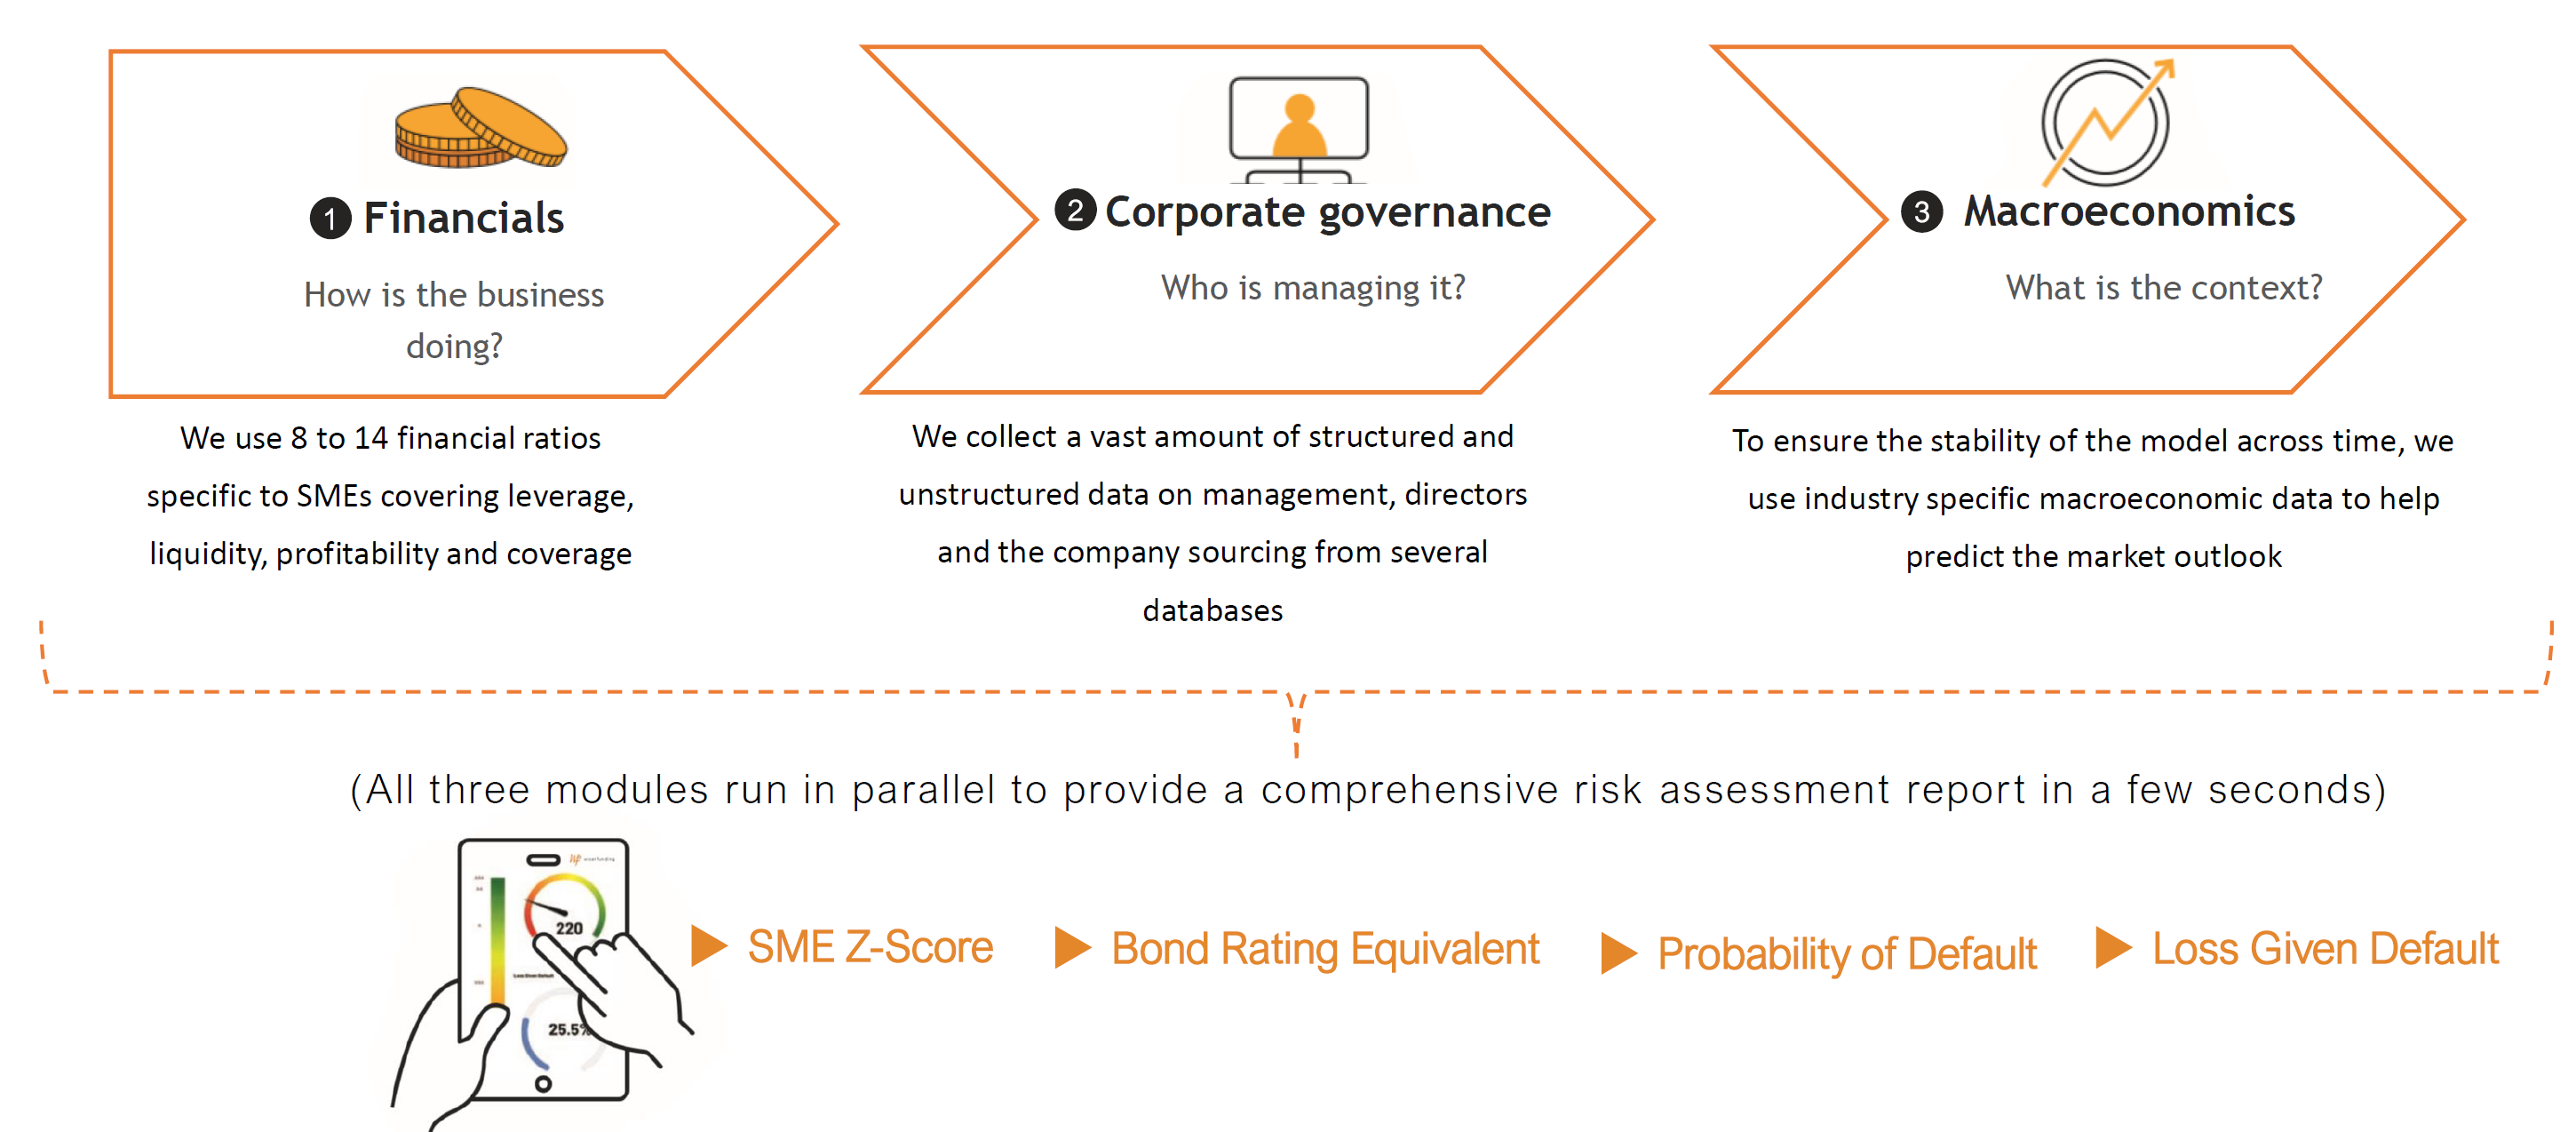
Figure 5
The 3 modules run in sequence with a modular structure that cannot be broken or separated (see Figure 5). This means that only when all 3 modules run, the output of them is meaningful. However, to overcome the issue of lack of data in any of the 3 modules, we have developed a system of dynamic weights that reduce the contribution of each module to the final risk assessment depending on the amount of input that we have been able to find. This methodology ensures that the module with the highest amount of information could contribute most to the final risk assessment.
Featured image credit: edited from Freepik