Best Countries in Asia-Pacific for Startups, Singapore top, Vietnam last
by Fintech News Singapore March 19, 2018The best countries for startups in Asia-Pacific have strong economies, relatively low cost of conducting business, healthy business environments and highly educated populations. Our scoring system is based on available data and each country’s rank across several categories. Lower scores indicate higher ranks, or better locations for startups.
1.Singapore
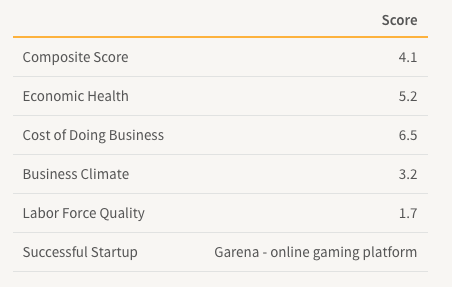
Singapore is rated by the World Bank as the second best country to conduct business, globally. It is a wealthy country (GDP per capita of $52,962), with low unemployment (2.15%) and good internet accessibility (81%).
While the country has a high cost of living, there are tax incentives for small businesses and it has the highest education rates (42% of working adults have post-secondary educations) in Asia. Finally, Singapore’s public institutions are highly regarded; the World Economic Forum ranks Singapore’s institutions second globally. These factors make it a great place for startups to grow their businesses.
2.Hong Kong
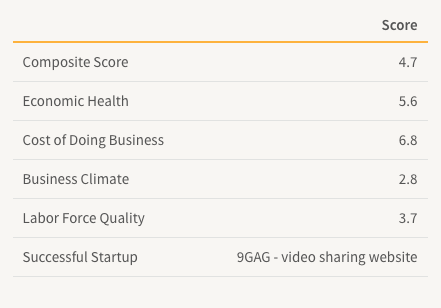
Startups in Hong Kong will find strong public institutions and availability of financing. It is similar to Singapore, in that it has strong economic indicators, with high GDP per capita ($43,741) and low unemployment (3.7%), and a high cost of living (#2 globally). Hong Kong is widely considered a great location for startups. The World Bank lists Hong Kong as the third best city globally to start a business. Additionally, interest rates and taxes are relatively low.
3.Japan
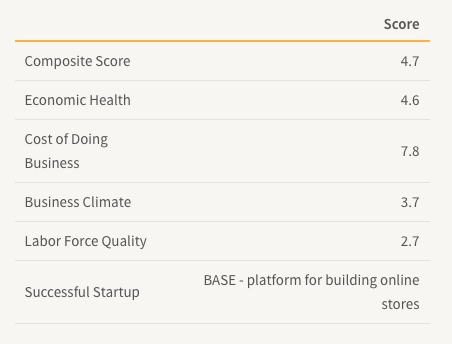
Japan is a great option for tech startups, as over 93% of its population has internet access. It also has extremely low interest rates and one of the most educated workforces globally (86% have at least a secondary degree). However, it can be an expensive place to start a business, with high corporate tax rates and salary expectations.
Summary of Top Countries for Startups in Asia-Pacific
Below are the top 12 countries in Asia-Pacific for startup businesses. Every startup has different circumstances and preferences, so we’ve expanded our data to show the top countries by each category. Lower scores indicate better ranks.
| Rank | Country | Composite Score | Economic Health | Cost of Doing Business | Business Climate | Labor Force Quality |
|---|---|---|---|---|---|---|
| 1 | Singapore | 4.1 | 5.2 | 6.5 | 3.2 | 1.7 |
| 2 | Hong Kong | 4.7 | 5.6 | 6.8 | 2.8 | 3.7 |
| 3 | Japan | 4.7 | 4.6 | 7.8 | 3.7 | 2.7 |
| 4 | Taiwan | 5.1 | 7.5 | 3.7 | 4.4 | 5.0 |
| 5 | Malaysia | 5.7 | 6.4 | 6.0 | 5.2 | 5.3 |
| 6 | South Korea | 6.0 | 5.6 | 7.5 | 6.7 | 4.3 |
| 7 | China | 6.6 | 4.0 | 6.8 | 6.7 | 9.0 |
| 8 | India | 7.1 | 7.2 | 4.7 | 7.5 | 9.0 |
| 9 | Indonesia | 7.3 | 8.0 | 5.0 | 8.0 | 8.3 |
| 10 | Thailand | 7.3 | 6.0 | 6.3 | 8.0 | 9.0 |
| 11 | Philippines | 7.8 | 8.6 | 7.0 | 10.7 | 5.0 |
| 12 | Vietnam | 8.5 | 8.0 | 5.8 | 10.0 | 10.3 |
Discussion of Categories
This study includes a wide variety of data in order to characterize each country’s business environment from the perspective of a startup. We categorize this data into four groups: economic health, cost of doing business, business climate, and labor force quality. Each score is based on the countries ranks across these categories.
Economic Health
The Economic Health category combines traditional economic indicators. These include GDP per capita, GDP per capita, unemployment rate and the proportion of adults with bank accounts. These measures give a picture of the relative strength of each country’s economy.
| Rank | Country | Total GDP(Billions) | GDP Growth | Unemployment Rate | % of Adults with a Bank Account | GDP per capita | Composite Score |
|---|---|---|---|---|---|---|---|
| 1 | China | $11,439 | 6.8% | 3.9% | 97.1% | $8,123 | 4.0 |
| 2 | Japan | $4,884 | 1.70% | 2.4% | 96.6% | $38,901 | 4.6 |
| 3 | Singapore | $306 | 3.5% | 2.1% | 96.5% | $52,962 | 5.2 |
| 4 | Hong Kong | $334 | 3.7% | 2.9% | 83.6% | $43,741 | 5.6 |
| 5 | South Korea | $1,530 | 3.1% | 3.3% | 95.7% | $27,539 | 5.65 |
| 6 | Thailand | $438 | 3.7% | 1.0% | 82.3% | $5,910 | 6.0 |
| 7 | Malaysia | $310 | 5.8% | 3.3% | 84.1% | $9,508 | 6.4 |
| 8 | India | $2,439 | 7.2% | 6.1% | 58.6% | $1,710 | 7.2 |
| 9 | Taiwan | $571 | 2.8% | 3.7% | Unknown | $25,893 | 7.5 |
| 10 | Indonesia | $1,011 | 5.1% | 5.5% | 45.3% | $3,570 | 8.0 |
| 11 | Vietnam | $216 | 6.5% | 2.3% | 39.5% | $2,171 | 8.0 |
| 12 | Philippines | $321 | 6.7% | 5.0% | 37.1% | $2,951 | 8.6 |
Cost of Doing Business
The cost of doing business category considers several costs associated with operating a business, including borrowing costs, tax rates and wage costs.
| Rank | Country | 10-Year Government Bond Rates | Cost of Living Rank | Salary Expectation Rank | Composite Score |
|---|---|---|---|---|---|
| 1 | Taiwan | 1.1% | 6 | Unknown | 3.7 |
| 2 | India | 7.7% | 1 | Unknown | 4.7 |
| 3 | Indonesia | 6.4% | 4 | 3 | 5.0 |
| 4 | Vietnam | 4.4% | 5 | 1 | 5.8 |
| 5 | Malaysia | 4.0% | 2 | 4 | 6.0 |
| 6 | Thailand | 2.5% | 7 | 5 | 6.3 |
| 7 | Singapore | 2.3% | 12 | 8 | 6.5 |
| 8 | China | 3.7% | 8 | 6 | 6.8 |
| 9 | Hong Kong | 2.1% | 11 | 7 | 6.8 |
| 10 | Philippines | 6.5% | 3 | 2 | 7.0 |
| 11 | South Korea | 2.8% | 9 | 10 | 7.5 |
| 12 | Japan | 0.04% | 10 | 9 | 7.8 |
Corporate tax rates are a crucial factor for all businesses. While Singapore is an expensive country to run a business, it offers tax incentives for startups. Exemptions for startups include 75% of the first S$100,000 earned and 50% of the next S$100,000. This exemption makes Singapore significantly less expensive for startups.
| Country | Statutory Tax Rate | Tax Exemptions/Notes |
|---|---|---|
| Taiwan | 17% | First TWD$120,000 is tax free |
| India | 30% | 0% for qualifying startups for first 3 years, 25% for SMEs |
| Indonesia | 25% | 12.5% for local company with revenue up to IDR 50 billion |
| Vietnam | 20% | Unknown |
| Malaysia | 24% | 18% on first MYR500,000 |
| Thailand | 20% | Unknown |
| Singapore | 17% | 75% exemption for first S$100,000, 50% exempt for next S$100,000 |
| China | 25% | 10 or 20% for SMEs |
| Hong Kong | 16.5% | Unknown |
| Philippines | 30% | Deduction for new, local companies |
| Japan | 23.4% | Unknown |
| South Korea | 25% | 10% on first KRW 200 million, 20% on KRW 200 million - KRW 20 billion |
Business Climate
The business climate category encapsulates many factors, ranging from businesses’ trust of public institutions, technological development and availability of funding. The rating based on these data points is designed to evaluate the ease of doing business and general business environment in each country.
| Country | Ease of Starting Business Rank | Public Institutions Rank | Internet Access | VC Access Rank | Market Dominance Rank | Banks per 100,000 Adults | Composite Score | |
|---|---|---|---|---|---|---|---|---|
| 1 | Hong Kong | 1 | 2 | 87.5% | 4 | 5 | 22.3 | 2.8 |
| 2 | Singapore | 2 | 1 | 81.0% | 1 | 3 | 9.3 | 3.2 |
| 3 | Japan | 7 | 3 | 93.2% | 9 | 1 | 34.1 | 3.7 |
| 4 | Taiwan | 4 | 5 | 79.7% | 6 | 2 | Unknown | 4.4 |
| 5 | Malaysia | 8 | 4 | 78.8% | 2 | 4 | 10.7 | 5.2 |
| 6 | China | 6 | 7 | 53.2% | 3 | 6 | 8.4 | 6.7 |
| 7 | South Korea | 3 | 9 | 92.8% | 11 | 10 | 16.9 | 6.7 |
| 8 | India | 11 | 6 | 29.6% | 5 | 7 | 13.5 | 7.5 |
| 9 | Indonesia | 10 | 8 | 25.4% | 7 | 8 | 17.8 | 8.0 |
| 10 | Thailand | 5 | 10 | 47.5% | 8 | 10 | 12.6 | 8.0 |
| 11 | Vietnam | 9 | 11 | 46.5% | 10 | 9 | 3.8 | 10.0 |
| 12 | Philippines | 12 | 12 | 55.5% | 12 | 12 | 8.8 | 10.7 |
Labor Force Quality
Access to a high quality workforce is essential for startups that wish to innovate and grow. While this can be a subjective metric, education rates can provide a proxy for the strength of a workforce. In this study we considered secondary and tertiary education attainment rates. Singapore, Korea and Japan are have very well-educated adult populations, which bodes well for startups hiring in these countries.
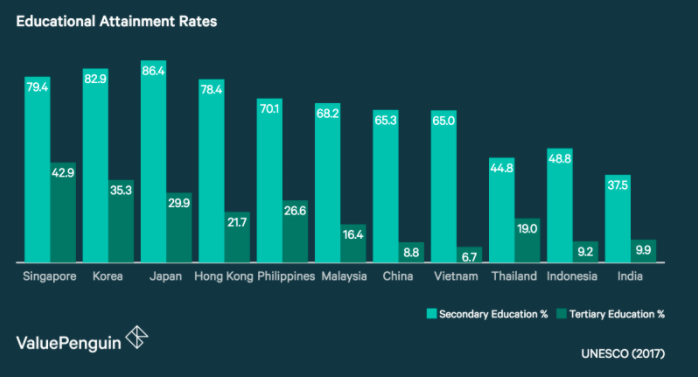
Because startups require a variety of skills, in addition to academic skills, we also considered the World Economic Forum’s local availability of specialized training services. Access to training allows startups to develop their employees skills and allows individuals to build skills in order to apply for new jobs.
| Country | Adults with Tertiary Education | Adults with at least Secondary Education | Local Availability of Training Rank | Composite Score | |
|---|---|---|---|---|---|
| 1 | Singapore | 42.9% | 79.4% | 1 | 1.7 |
| 2 | Japan | 29.9% | 86.4% | 4 | 2.7 |
| 3 | Hong Kong | 21.7% | 78.4% | 2 | 3.7 |
| 4 | Korea | 35.3% | 82.9% | 9 | 4.3 |
| 5 | Philippines | 26.6% | 70.1% | 6 | 5.0 |
| 6 | Taiwan | Unknown | Unknown | 5 | 5.0 |
| 7 | Malaysia | 16.4% | 68.2% | 3 | 5.3 |
| 8 | Indonesia | 9.2% | 48.8% | 7 | 8.3 |
| 9 | China | 8.8% | 65.3% | 10 | 9.0 |
| 10 | India | 9.9% | 37.5% | 8 | 9.0 |
| 11 | Thailand | 19.0% | 44.8% | 11 | 9.0 |
| 12 | Vietnam | 6.7% | 65.0% | 12 | 10.3 |
Featured image via Freepik


