


If there is one thing that most of us can agree on it probably is that cryptocurrency markets are very dynamic, ever-changing and fast-moving.
In this monthly publication Lightbulb Capital reviews of some of the key data points.
We highlight key changes in market dynamics but do not seek to explain them. While we have opinions on the forces driving markets, we do not impose them and leave it to the reader to interpret the data. We welcome debate. Over time we will create a time series of data points which we hope will become increasingly useful.
Today’s review covers the period 1 August to 31 August 2018.

To start: we believe that monitoring changes in;
- Correlations (to identify changes in relationships),
- Volatility (as a risk measure), and
- the Sortino ratio (as a measure of risk-adjusted return)
are useful to indicators of market dynamics.
While some have already given up on the current FIAT world, we believe that there is a continuing need to look at traditional and digital assets to understand the bigger picture.
We, therefore, picked the following proxies to represent a blend of both:
- the top 10 coins by market capitalisation (on 1st August 2018, Source: coinmarketcap.com),
- S&P 500, Gold,
- CBOE Volatility Index (VIX),
- iShares Core U.S. Aggregate Bond ETF (AGG)
- and Vanguard REIT ETF (VNQ)
1. Correlations
We published a similar matrix a few months ago that showed that there were very high correlations between cryptocurrencies equity markets (specifically the S&P 500). This has now changed. Previously (Dec 2016 to Dec 2017) high correlation between BTC/ETH (0.87 – now 0.59) and BTC/ADA (0.80 – now 0.59) has also broken down.
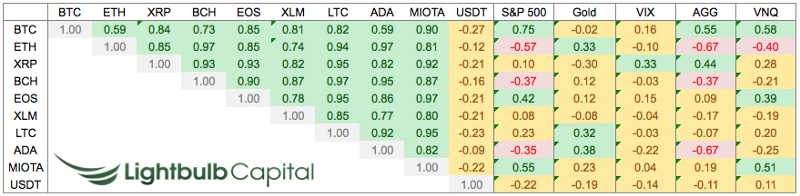
Source: Lightbulb Capital
2. Volatility
We look at Volatility as measured by the standard deviation of daily returns. And yes, on average crypto currencies have a very high volatility compared to traditional assets.
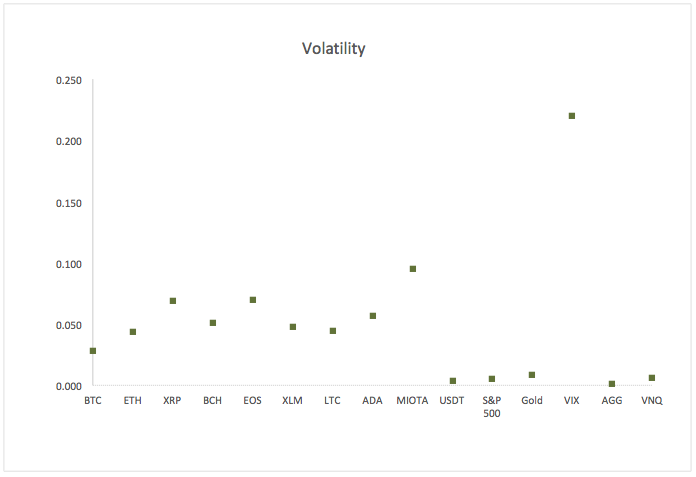
Source: Lightbulb Capital
3. Sortino Ratio
We believe the Sortino ratio to be a better measure for risk-adjusted returns than for example the Sharpe Ratio because it does not “punish” for “upside volatility” on which the asset owner realizes capital gains. As expected, the loss of market capitalization and the downward movement in all major digital assets, therefore, result in a negative Sortino Ratio for the period:
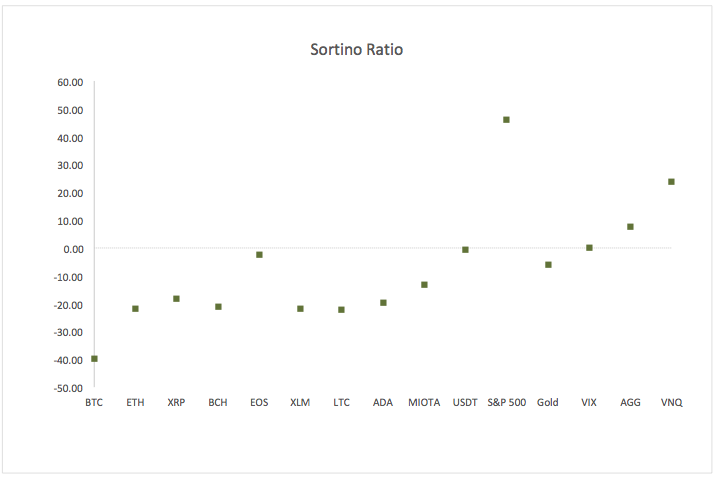
Source: Lightbulb Capital
This article first appeared on medium.com