
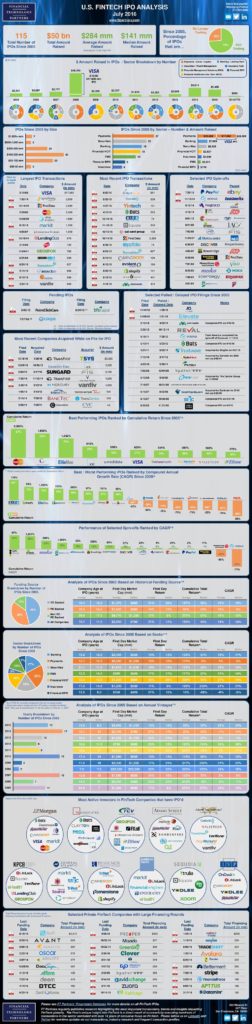
Financial Technology Partners did a research on U.S. Fintech IPO scence since 2005. The analysis details into:
– $ Amount Raised in IPOs/ Sector Breakdown by Number
– IPOs Since 2005 by Size, by Sector – Number & Amount Raised
– Largest and Most Recent IPO Transactions
– Selected IPO Spin-offs
– Pending IPOs
– Selected Pulled/ Delayed IPO Filings Since 2005
– Most Recent Companies Acquired While on File for IPO
– Best Performing IPOs Ranked by Cumulative Return Since 2005
– Best/ Worst Performing IPOs Ranked by Compound Annual Growth Rate (CAGR) Since 2005
– Performance of Selected Spin-offs Ranked by CAGR
– Funding Source Breakdown by Number of IPOs Since 2005
– Analysis of IPOs Since 2005 Based on Historical Funding Source
– Sector Breakdown by Number of IPOs Since 2005
– Analysis of IPOs Since 2005 Based on Sector
– Yearly Breakdown by Number of IPOs Since 2005
– Analysis of IPOs Since 2005 Based on Annual Vintages
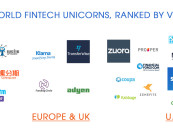
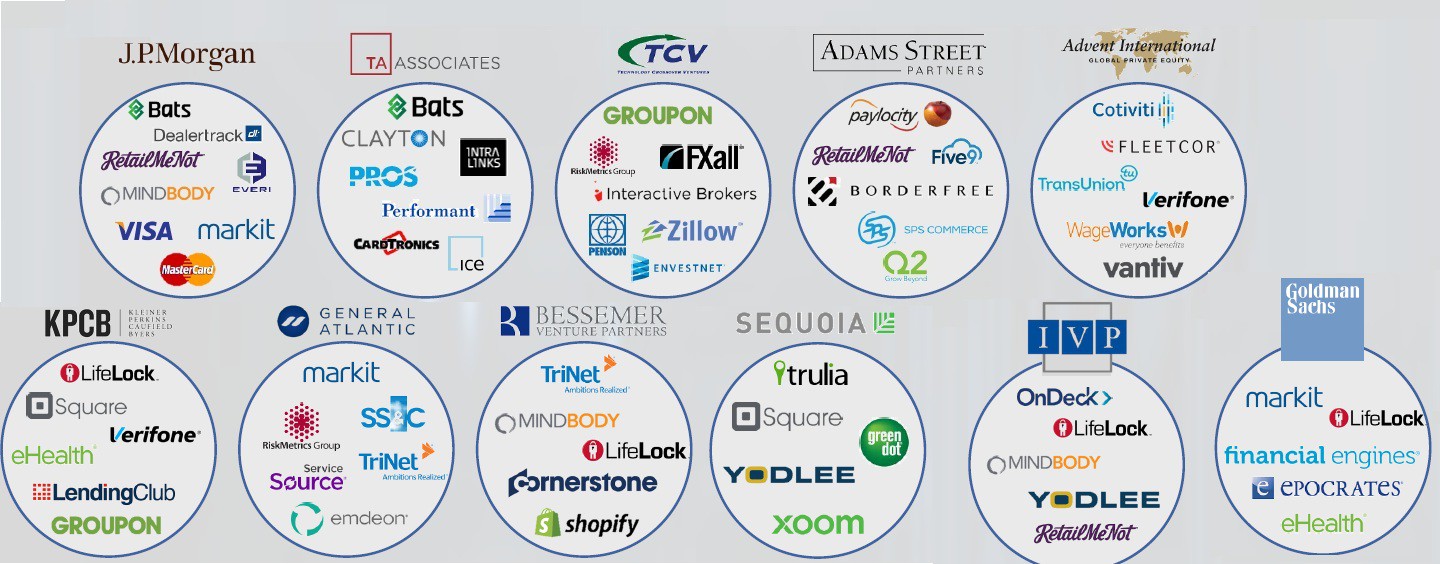
– Most Active Investors in FinTech Companies that have IPO’d
– Selected Private FinTech Companies with Large Financing Rounds
Get the hottest Fintech Singapore News once a month in your Inbox