Smart Cities Spending Guide Expects Technologies Enabling Smart Cities Initiatives to Reach $28.3 Billion in 2018
by Fintech News Singapore May 9, 2018Asia/Pacific (excluding Japan) on the technologies that enable Smart Cities initiatives is expected to reach $28.3 billion in 2018, according to the first-ever IDC Worldwide Semiannual Smart Cities Spending Guide. In its inaugural release, IDC provides a comprehensive outlook at the technology investments associated with a range of Smart Cities priorities and use cases. As these initiatives gain traction, IDC expects spending to accelerate over the 2016-2021 forecast period, reaching to $45.3 billion in 2021.

Gerald Wang
“For the first time since 2006, when IDC first discovered and documented the birth of Smart Cities, we are proud to launch our global Smart Cities tracker and spending guide.
This research spans an exhaustive compilation of worldwide Smart City projects across a wide 41 categories of use cases.
This is expected to aid both technology buyers as well as market suppliers to have a greater grasp of the broad trends, niche opportunities, as well as best practices in both regional and global Smart City programs,”
said Gerald Wang, Head of Public Sector at IDC Asia Pacific.
Wang adds,
“Key investments for Asia Pacific Smart Cities are notably in intelligent transportation, data-driven public safety, and resilient energy and infrastructure, although a deeper dive suggests different prioritization across 1st, 2nd and 3rd tier cities in the region.”
Intelligent traffic transit and Fixed usual surveillance are seeing maximum impetus from the government sector for streamlining the traffic and towards more secured cities, the two use cases, representing more than 36% share of the overall spending throughout the forecast period (2017-21).
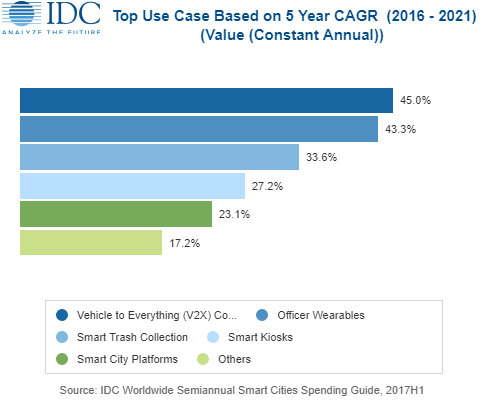
However, over the forecast period (2017-21), Vehicle to Everything (V2X) Connectivity and Officer Wearables (Fitbit/smart glasses) use cases will grow exceptionally at a five-year CAGR of 45% and 43.3% respectively.

Services account for the highest spending with 32.5% share of the overall spending in 2017, and the trend is likely to observe a linear growth with a five-year CAGR (17-21) of 21.2% and reach $16.7 billion by 2021. Hardware is the second largest technology group with $31.7 billion spending followed by Software (18.0%) and Connectivity (17.8%) for 2017.
Throughout the forecast period, software is expected to grow fastest at a five-year CAGR of 17.7% and reach $8.3 billion by 2021. In all the four segments of technology groups, State/Local Government and Transportation are the two leading industries with the maximum usage of Fixed Visual Surveillance and intelligent transportation use cases. These use cases attract considerable investments in all the countries of APeJ.
Fixed Visual Surveillance will be the leading use case in China, accounting for 21.1% share with the ongoing popularity of cloud services in the telecom sector. China has planned to transform its 500 cities to the smart city, of which 290 cities have started the smart city pilot projects backed by the agreements signed with IT companies and other major Chinese telecommunication companies (Ant Financial and Tencent). Whilst, other countries like Singapore, Korea and India are the other countries emerging with smart city initiatives.
“With the fast influx of population to urban areas in APeJ, It would be a challenge for all the government to supply Sufficient fresh water; universal access to cleaner energy; the ability to travel efficiently from one point to another and a sense of safety and security, these are the kinds of promises smart cities must fulfil if they are to stay competitive and provide a decent quality of life to their citizens,”
said Ashutosh Bisht, Research Manager, IDC Asia Pacific.
IDC’s Worldwide Semiannual Smart Cities Spending Guide quantifies the expected technology opportunity around smart cities initiatives from a region and worldwide level. Spending data is available for nine regions with a focus on 15 use cases across five strategic priorities, as well as the overall Smart Cities market size.
The spending guide is designed to provide IT vendors with insights into this rapidly growing market and how the market will develop over the five-year forecast period.
Featured image via Freepik